前言
在之前的文档中,有了解Prometheus采集数据的三种方式,其中Exporters是最常用的方式。
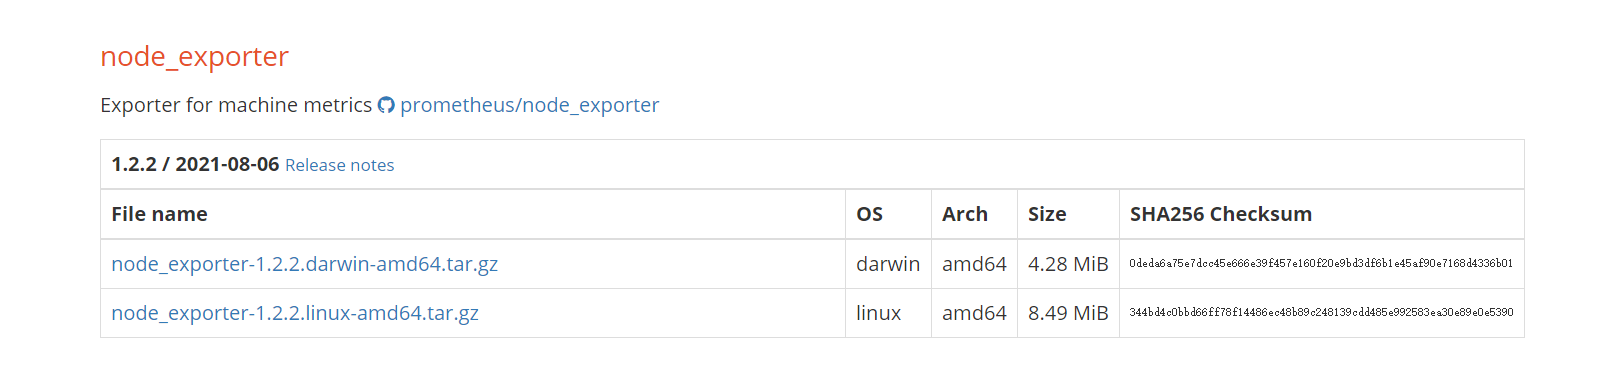
官方提供了很多exporter,下载地址。
如果官网找不到,但是也列述了很多开源社区提供的exporter。
node_exporter
GitHub地址
node_exporter用 Go 编写,带有可插入的指标收集器,是官方提供的硬件和操作系统指标exporter导出器。
监控多台Linux服务器案例步骤
1. 下载安装node_exporter
直接在官方下载压缩包安装,不建议将其部署为 Docker 容器,因为它需要访问主机系统。
解压,安装为服务启动。
# 上传并解压
[root@aaasds bin]# tar -zxvf node_exporter-1.2.2.linux-amd64.tar.gz
[root@aaasds bin]# cd node_exporter-1.2.2.linux-amd64/
[root@k3s002 opt]# mv node_exporter-1.2.2.linux-amd64/node_exporter /usr/local/bin/
[root@k3s002 opt]#  vi /etc/systemd/system/node_exporter.service
# 添加如下内容
[Unit]
Description=node_exporter
After=network.target
[Service]
Type=simple
User=root
# 指定启动的端口和日志级别
ExecStart=/usr/local/bin/node_exporter --web.listen-address=:9109 --log.level=error
MemoryLimit=300M
CPUQuota=100%
Restart=on-failure
[Install]
WantedBy=multi-user.target
# 启动并设置开启自启
[root@aaasds node]#  systemctl daemon-reload
[root@aaasds node]# systemctl start  node_exporter.service
[root@aaasds node]# systemctl enable node_exporter.service
[root@aaasds node]# systemctl status node_exporter.service
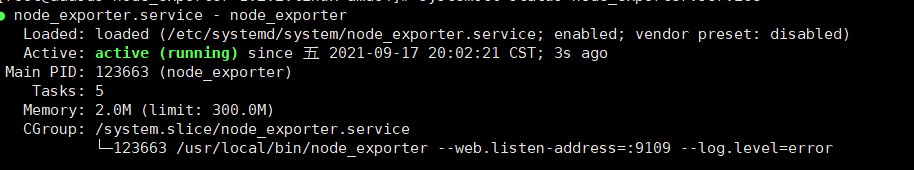
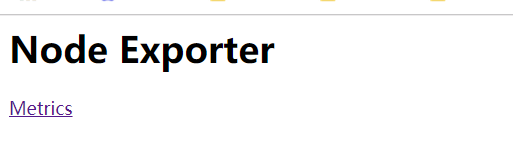
然后访问IP+ 启动端口,出现以下页面,表示启动成功,其他服务器也按照这种方式安装即可。
2. Prometheus配置
[root@node8245 conf]# vim prometheus.yml
在配置中添加一个名为nodes任务,并添加多个服务器地址,重启Prometheus。
scrape_configs:
# The job name is added as a label job=`<job_name>` to any timeseries scraped from this config.
- job_name: 'prometheus'
# metrics_path defaults to '/metrics'
# scheme defaults to 'http'.
static_configs:
- targets: ['192.168.8.25:9090']
# Linux 服务器 监控
- job_name: nodes
static_configs:
# 添加多个服务器节点
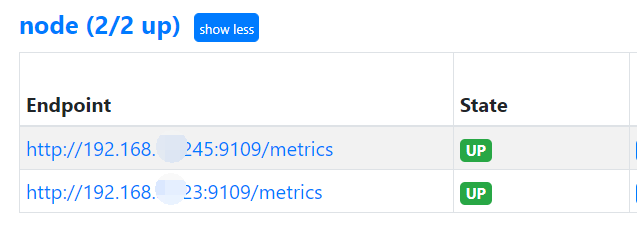
- targets: ['192.168.8.25:9109','192.168.8.23:9109']
进入Prometheus查看target,可以看到已经抓取到了node_exporter数据。
3. Grafana配置
Prometheus已经有数据了,接下来需要在Grafana导入仪表盘了。
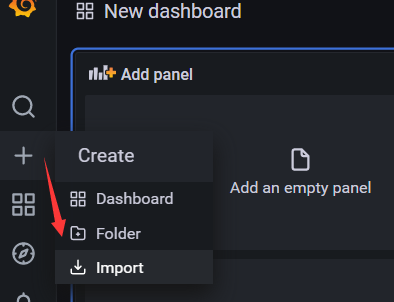
Grafana首页点击加号,选择import导入。
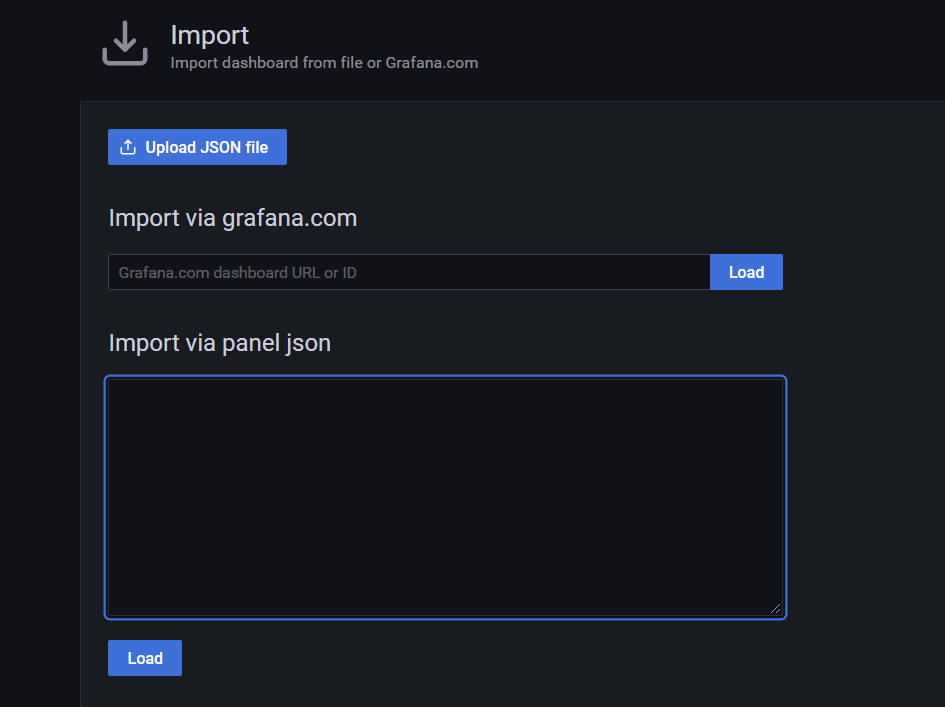
这里可以直接输入官方网站中的仪表盘ID或者URL,联网的情况下比较好使,也可以直接复制Json文件。
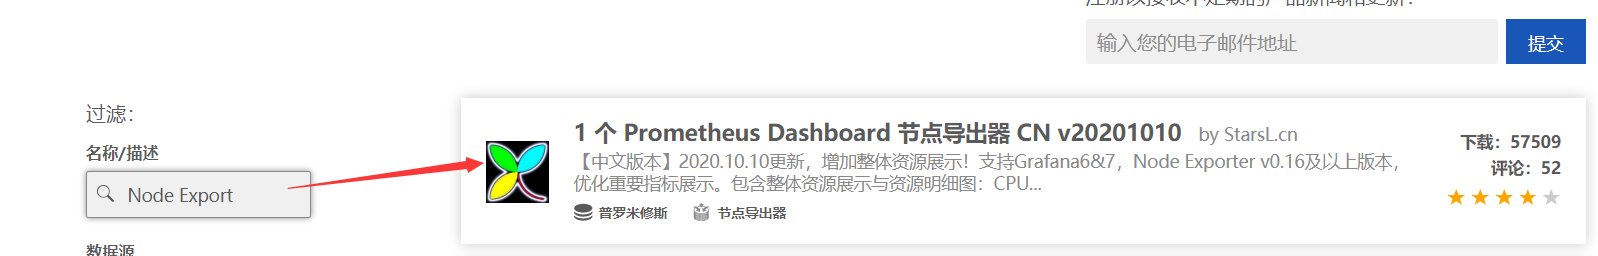
官方网站搜索Node Export,直接选择中文版的。
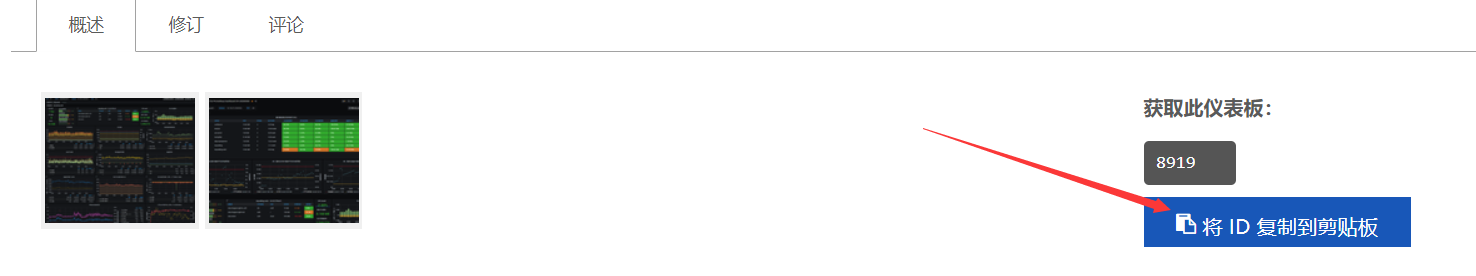
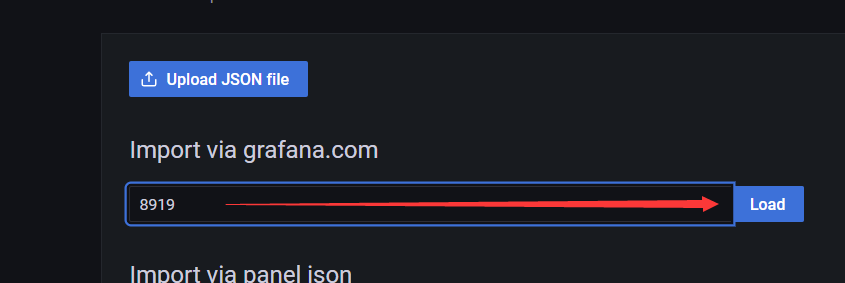
点击后,复制ID。
在import页面中填入并点击Load。
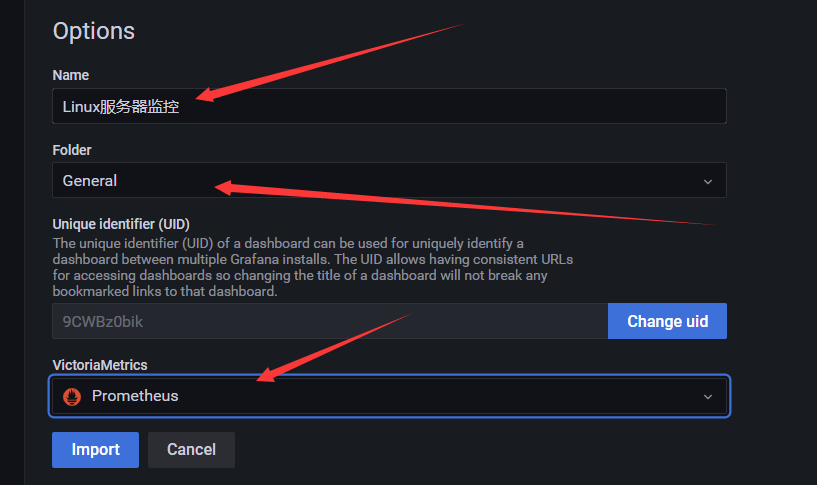
然后填写仪表盘名称,选择数据源,点击导入。
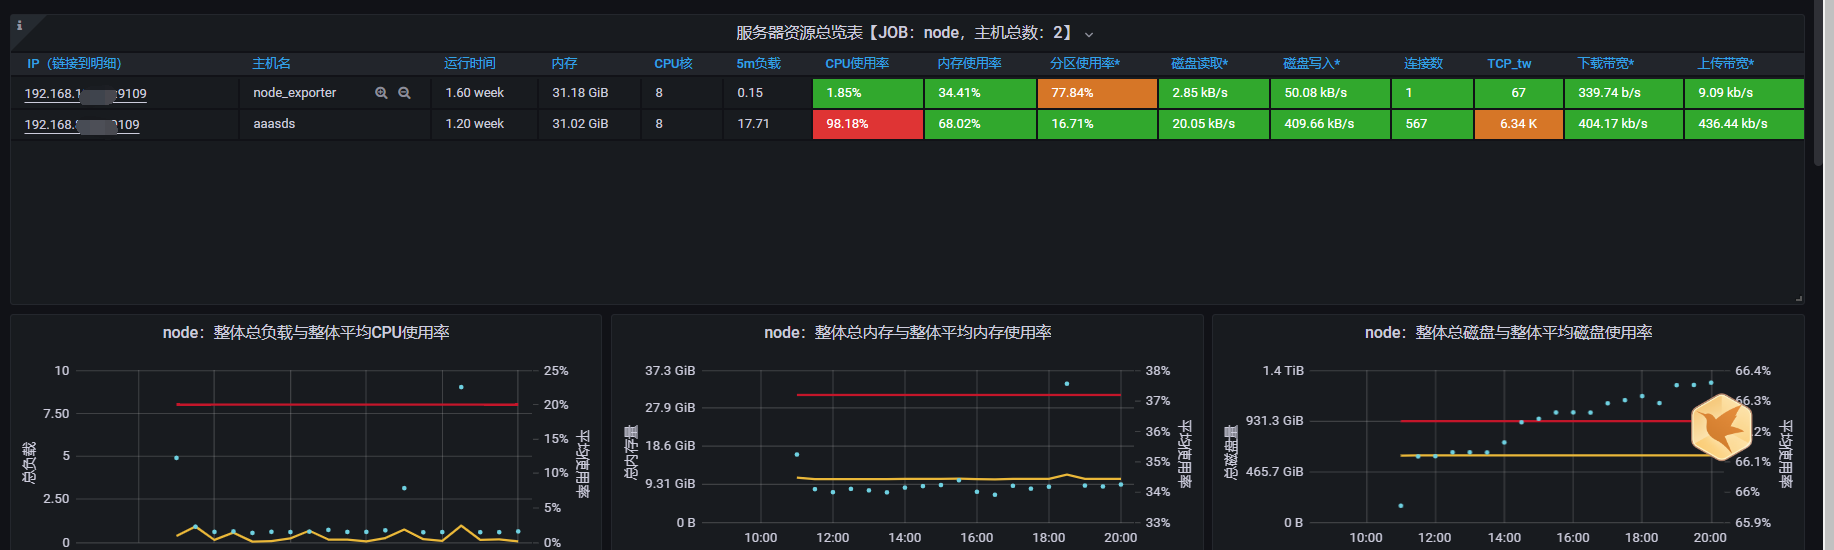
然后就可以看到效果图了,搞定。
版权声明:本文不是「本站」原创文章,版权归原作者所有 | 原文地址: